Fever Monitoring Medical Patch App UI
Client: Trans Vitals Pvt. Ltd.
Role: Lead UX/UI Designer
Timeline: Oct - Dec 2024
While working as the sole UX/UI designer at Trans Vitals Pvt. Ltd., I led the design of a temperature monitoring medical patch app aimed at transforming how people track and manage their health. Designed for individuals with limited access to healthcare or chronic conditions like TB and jaundice, the app offers a unique blend of fun, gamified interactions and actionable health insights.


The Problem
Managing health data and ensuring accurate monitoring can be challenging, especially when dealing with multiple variables like temperature, symptoms, and medication. The current process lacks an integrated system to effectively track and analyze this information in real time. Without a cohesive platform, it becomes difficult to monitor health trends, predict illnesses, or ensure patients are following their prescribed treatment plans, ultimately affecting the quality of care and patient engagement.
Project Goals
Create a gamified and engaging symptom tracking experience.
Design a visual and intuitive dashboard for predictive insights.
Develop a comprehensive medication log for efficient dose management.
Research Phase
In the research phase, I conducted user interviews with two primary groups: patients with chronic illnesses and caregivers. Users expressed a need for quick, engaging symptom tracking that felt less repetitive. They also highlighted the value of visualizing health trends, which helped them make sense of their data. Medication tracking had to be simple yet comprehensive.
I also analyzed existing health apps to identify strengths and weaknesses. While many had clear visuals and easy navigation, they lacked engaging symptom forms and personalization. These insights guided the design, focusing on an interactive, user-friendly experience that catered to users’ needs.
The Solution
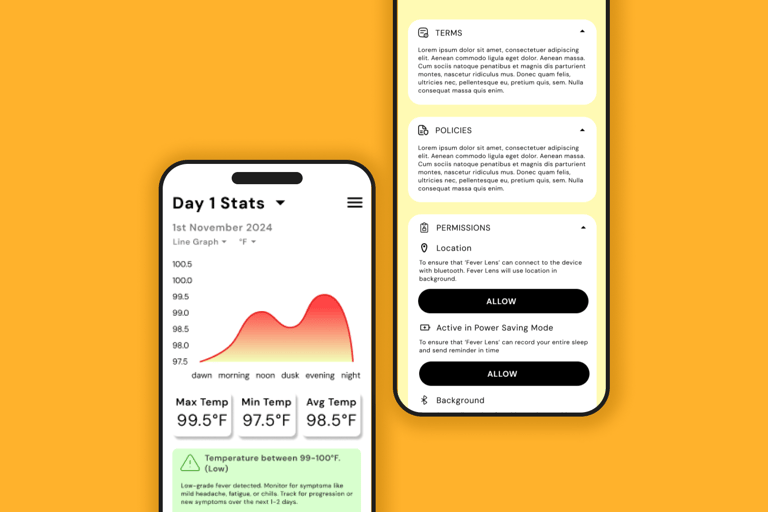
Based on user research, I identified key areas for improvement in the app’s design. To make symptom logging less repetitive, I gamified the process with interactive toggles for quick responses, sliders to rate severity, and a progress bar to encourage completion. To help users track their health, I created a feature that visualizes temperature trends over time, allowing them to easily see fluctuations and patterns in their data. Predictive insights are provided after collecting 3-7 days of data, helping users understand potential illness trends. For medication management, I designed a simple, timeline-based tracker with color-coded doses and reminder notifications to ensure users stay on schedule.
Design Process
WIREFRAMES
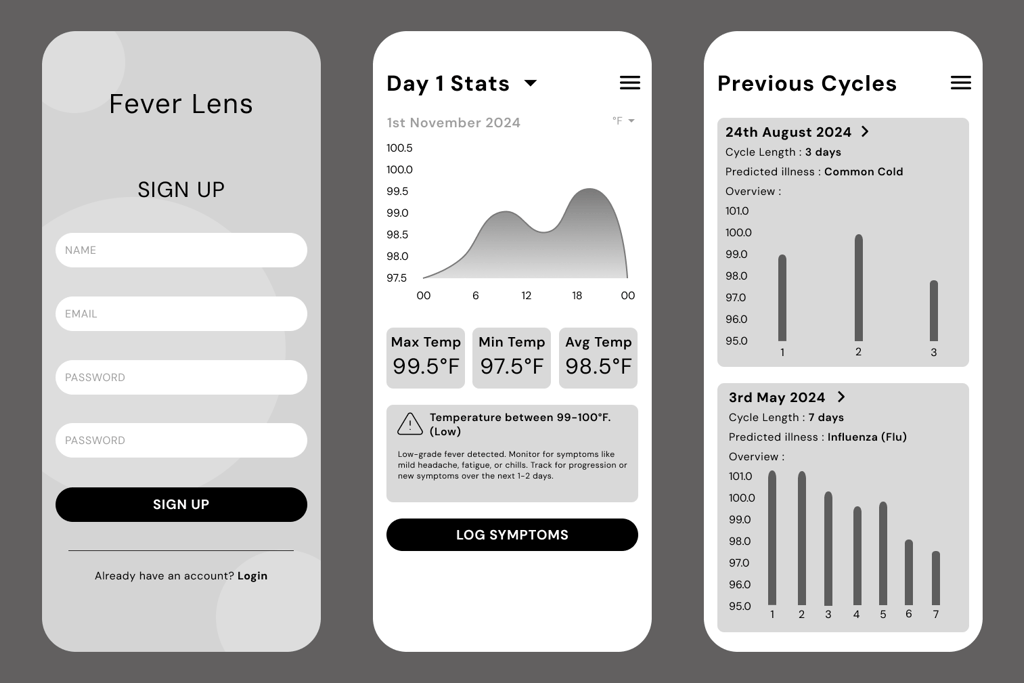
To streamline navigation and ensure ease of use, I started with low-fidelity wireframes. These focused on making all key features accessible within three taps, emphasizing simplicity and efficiency. After reviewing the wireframes with the Product Manager, developers, and stakeholders, I incorporated their feedback and moved forward with usability tests to refine the layout and functionality.


HIGH FIDELITY PROTOTYPES
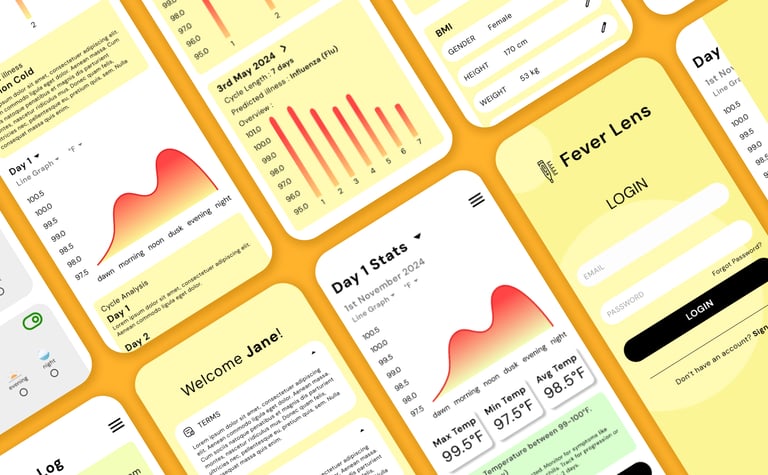
Once confident in the wireframes, I created visually polished prototypes to bring the design to life. These prototypes highlighted interaction flows, ensuring seamless usability while maintaining the app’s aesthetic appeal.
USABILITY TESTING
I tested the prototypes with real users to validate design decisions and identify areas for improvement. Feedback led to key changes, such as adjusting slider sensitivity for smoother inputs and simplifying the dashboard language for better comprehension.
Final Design


Saaniya Phatak
Crafting user experiences that inspire and engage.
Quick Navigation
© 2024. All rights reserved.